Earth observation 1: Forestry
I remember in my early years hearing about astronauts being able to read newspapers from space using huge telescopes. How the Great Wall of China was the only man made structure visible from space. Later, how the colour of soil related to early climates of Mars from the US’s first rover. These were ground-breaking, astounding things that I accepted and never really took much time to consider.
Whilst true or not (I’ll leave that to you), considering these questions is at the heart of observation, and Earth Observation as a field was born out of this, with a goal of understanding the processes driving life on our planet, how they were and how they will be. The space sector is now booming with infrastructure increasing and potential for things such as crowd-funded satellites, something I wouldn’t ever have dreamt of.
With this in mind, how do we measure the amount of Carbon on Earth, in the ocean, in the atmosphere using all of this technology? The uncertainty in greenhouse gas estimates and their affects has plagued us in recent decades, and has allowed sceptics to muddy the waters for how we should react. One doesn’t have to go too far back to be reminded of the hacking of UEA’s CRU emails and all it entailed for climate science. Regardless of the politics and policies, the fundamental task of generating an accurate database of global nutrient stocks remains high on the environmental science agenda. For now, let’s have a look at tropical forests, a critical part of the carbon budget.
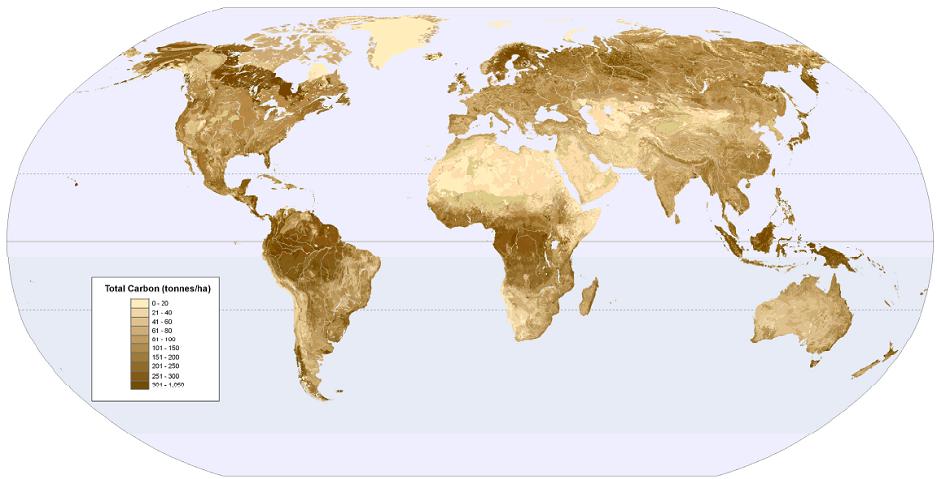
Global terrestrial carbon map, from the United Nations Environment Programme, 2008.
Efforts have been made at providing initial estimations of terrestrial carbon stocks in forests, with a number of different methods and technologies being utilised. In essence, directly weighing something like carbon requires cutting down trees – this is laborious and makes major assumptions about wood density and leads to major extrapolation at a global scale. Thus, Earth observation scientists just try to measure something else that’s a bit easier to get at (Height of the forest canopy, for example) and relate it to nutrient amounts through some sort of model. This modelling approach is typical across the sciences, but in this context leads to wildly varying estimates depending on the accuracy of the information inputted and the model used. More accurate observations, both from space and on the ground, would help a great deal, and this is where technology steps in.
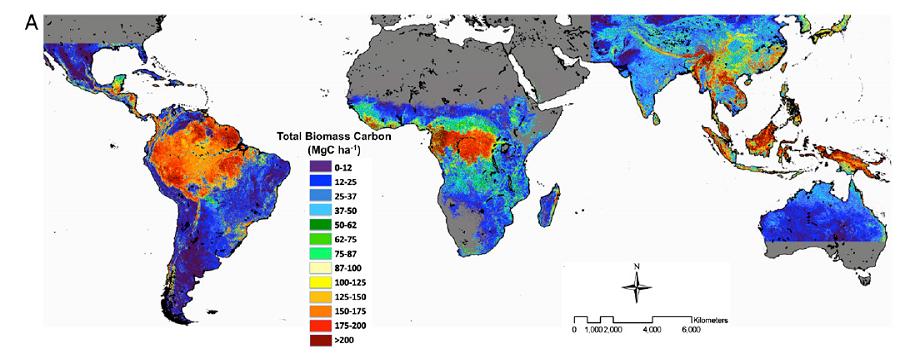
A benchmark carbon stock map of forests developed by Saatchi in 2011 has recently been called into question by a group of leading ecologists who say it doesn’t pick up major variations present in their measured ground samples.
‘Global monitoring and environmental security (GMES)’, a concept introduced in the noughties by the European Space Agency (ESA), has very clear goals – provide timely information on the environment within which we find ourselves in order to ensure a degree of civil security. This will entail the launch of five ‘sentinel’ satellite missions, a group of tailor made earth observation specialist satellites with very different but complimentary roles. The launch of Sentinel 1 last April, the first in a two part tandem RADAR mission, sounded the beginning of the Sentinel series and the first part of Sentinel 2 is being launched in the very near future. ESA have embarked on an ambitious mission to generate observations designed to fill in some of the outstanding gaps.
These satellites will be used in conjunction with the Earth explorer series of satellites to provide updates in estimates of the standing carbon pools in tropical forestry. With this array of cutting edge technology and future plans for more advanced versions of RADAR measurements what’s the limiting factor here? Why do global forestry carbon stock estimates differ so much, with seemingly no relationship in how they map local variations?
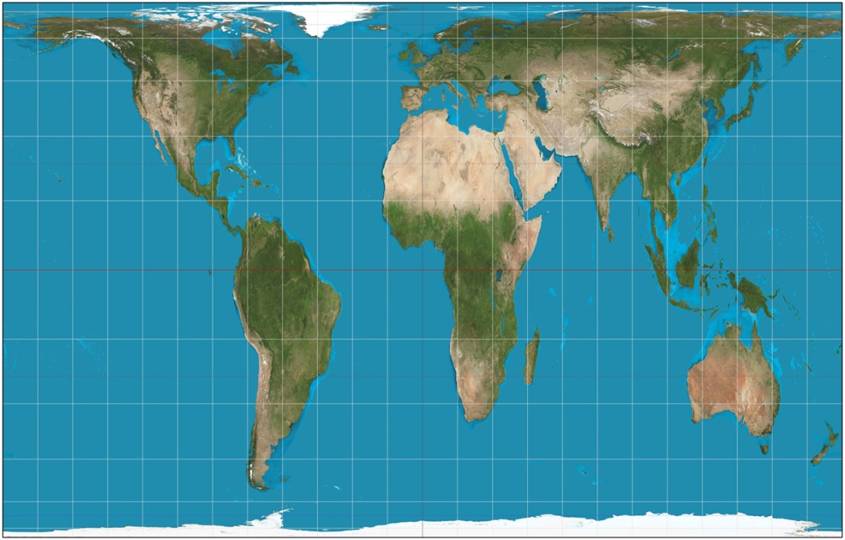
The answer is made of many reasons, with one being that the world is bigger than most people think. The Mercator projection which we all know and love is a cruel mistress, hiding the fact that tropical forests actually cover a far greater region of the planet than it seems. The Peter-Gall area accurate projection illustrates this nicely, and is my go to for explaining one the first obstacles in global estimates of anything. It shows Europe as the relatively small patch it is in the Northern hemisphere, with the menacing Sahara and Amazonian basin put in context in terms of their importance for environmental security. If we had a standard method for measurement across the globe this wouldn’t be as big of an issue, but coordinating efforts over a range of different countries at various stages of developments is easier said than done, though initiatives such as REDD+ hope to fill in this role.
Peter-Gall projection, an area accurate map of the world.
Add to this that accounting for every variable across this scale in a model is very difficult (though we must try!), and every added parameter within a model needs to be properly accounted for and the challenge is clear. In summary we have patchy data, the world is huge and we can never have enough computers.
While this new generation of satellites will help (With other commercial space ventures potentially proving useful too), many scientists are looking to increase accuracies at a finer scale, with some focusing on measuring terrestrial carbon stocks from drones and others using ground based lasers to directly measure tree volumes, and relating that to carbon stocks. These will become crucial in providing truth for the carbon budget, as the importance of ground data to bolster satellite observations was demonstrated in 2010 when the IPCC made a blunder about the rate of retreat of Himalayan glaciers.
Integrating all of this information into a form which can be interpreted easily and actually focused to provide reasonable predictions falls within the realm of ‘data assimilation’, an area of very chunky statistics that isn’t for the faint of hearted. Trudging through the avalanche of numbers yields answers to some of the most complex questions ever asked, and adds the civil security that GMES originally sought out from its inception.
People can often be overwhelmed when confronted with realities of environmental change and what it means for the future of our planet. The worst thing we can do is ignore it and so any effort to model and monitor the crucial assets that allow life on Earth is worth applauding. Forestry is frequently the hot topic for environmental news, but is just one piece of a complex puzzle of which the various tools of Earth Observation are helping us gain a deeper understanding. In the next few contributions I’ll be looking at monitoring of other ecosystems to help build a picture of how scientists go about predicting the future of the planet’s climate.


